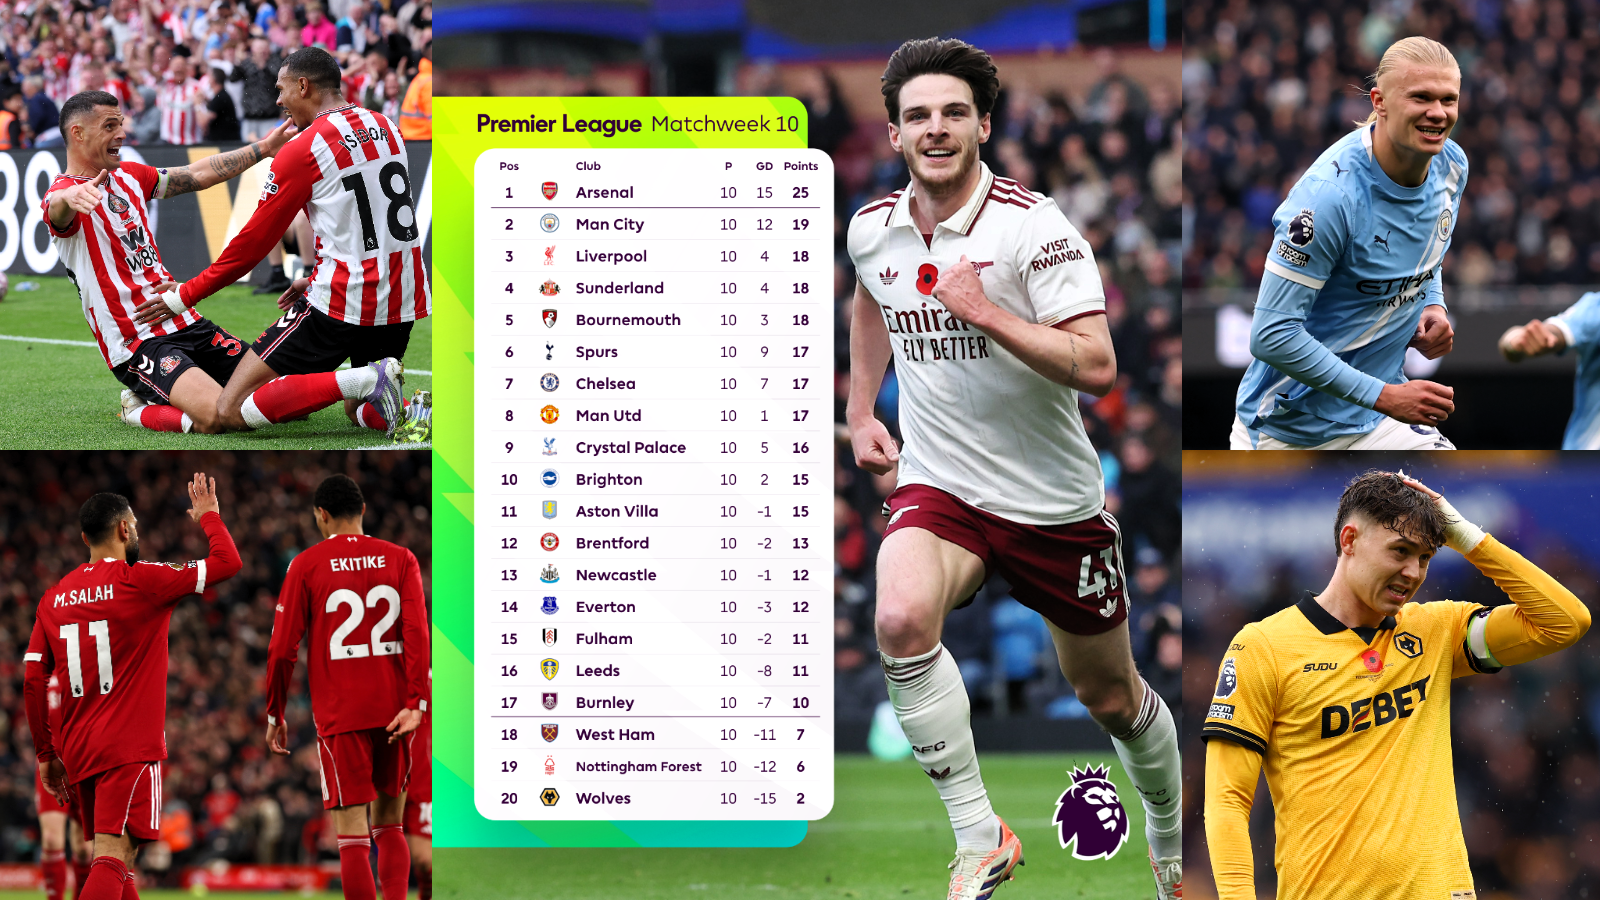
We look through history to see how many changes usually occur from Matchweek 10 to Matchweek 38
Monday night’s 1-1 draw between Sunderland and Everton was the 100th match of the 2025/26 Premier League season.
Each club have played 10 matches, or 26 per cent of the campaign, and pundits and fans are already drawing conclusions about where teams will finish.
But does the league table at the 100-game mark give a reliable indication of what’s ahead?
Football writer Alex Keble has sifted through the data from every Premier League season this century, from 1999/00 onwards, to see just how much change usually occurs between Matchweek 10 and the end of the campaign.
How often do the leaders go on to win the title?
Including 1999/00, we have had 26 full seasons this century, and in 12 of them – or 46 per cent – the league leaders at the 10-round mark have gone on to win the competition.
That’s just under half, meaning that the majority of the time the club out in front after 100 matches do NOT win the Premier League. That is bad news for Arsenal.
Where the winner comes from is surprisingly diverse, too. On two occasions the team in sixth at this stage have gone on to win it (Manchester United in 2008/09 and Manchester City in 2020/21).
Strangely enough, more teams in third at the MW10 mark (five) have gone on to win it than teams in second (four).
Champions’ position after MW10 since 1999/00
| Position | Total |
|---|---|
| 1st | 12 |
| 2nd | 4 |
| 3rd | 5 |
| 4th | 1 |
| 5th | 2 |
| 6th | 2 |
Perhaps the most interesting conclusion to draw is that 21 of the 26 title-winners this century (81 per cent) were already in the top three after 10 rounds had been played.
That does not bode well for outsiders Chelsea, currently down in seventh, a position from which no team have lifted the trophy in the 21st century.
Indeed over the last nine seasons, only once has a team who have been below third place at this stage gone on to win it, and that was in the empty-stadium, anomalous 2020/21 COVID year, when Man City were sixth after MW10.
There is even better news for Man City fans.
Remarkably, only once in the last five campaigns has the team in first place after Matchweek 10 gone on to win the title, and that was Liverpool last season.
The other four were all won by Man City, who, in chronological order, recovered from sixth, third, second and third to become champions.
Pep Guardiola’s side, then, are in their usual place in 2025/26. Their rivals ought to fear how often City have accelerated from this position.
How much does the top four change?
Since the turn of the century there has been an average of 1.5 changes to the top four from MW10 to MW38.
That suggests relatively significant movement, although this has slowed considerably over time. In the first 10 years of the century, the average was 1.9; in the last 10 years it is 1.3.
These are noteworthy numbers considering that Chelsea, Tottenham Hotspur, Man Utd, Newcastle United and Aston Villa all harbour ambitions to finish in the top four and qualify for the UEFA Champions League – yet none are currently in position.
In fact, it adds weight to the theory that the current top three of Arsenal, Man City and Liverpool will stay there.
But where do the gatecrashers come from?
Looking at the last 10 seasons, in which there have been 13 occasions of a team moving from outside the top four at MW10 to within it by season close, seven (54 per cent) have risen from fifth and a further three (23 per cent) have risen from sixth.
In other words, more than 75 per cent of all the teams who gatecrash do so from just one or two places below the top four. At the top end, the league table is mostly set by MW10.
Top-four position changes: MW10 v MW38
| Season | No. of position changes | MW10 position of gatecrashing teams |
|---|---|---|
| 2015/16 | 2 | 5th, 6th |
| 2016/17 | 1 | 5th |
| 2017/18 | 1 | 5th |
| 2018/19 | 1 | 5th |
| 2019/20 | 1 | 7th |
| 2020/21 | 2 | 6th, 7th |
| 2021/22 | 1 | 9th |
| 2022/23 | 2 | 5th, 6th |
| 2023/24 | 1 | 5th |
| 2024/25 | 1 | 5th |
Scroll across to see the full table
Looking at the above table, aside from the exception of 2021/22 when ninth-placed Spurs rose to finish fourth, you just don’t get teams flying up from midtable.
That is a serious concern for Man Utd (eighth), Villa (11th) and Newcastle (13th), although of course the possibility that the fifth-placed team will get a Champions League spot – as they did last season – softens the blow.
How set is the relegation battle after MW10?
The average number of changes to the bottom three between MW10 and MW38 is 1.35, but as with the top-four race, this is dropping over time.
In the first 10 years, the average was 1.6 per season, whereas over the last decade it has been 1.1.
What’s more, over the last seven campaigns there hasn’t been a single instance of more than one club falling into the relegation zone after MW10.
Position changes in bottom three: MW10 v MW38
| Season | Total |
|---|---|
| 2018/19 | 1 |
| 2019/20 | 1 |
| 2020/21 | 1 |
| 2021/22 | 1 |
| 2022/23 | 1 |
| 2023/24 | 0 |
| 2024/25 | 1 |
Only twice this century has there been no movement whatsoever – once in 2006/07 and again just two seasons ago in 2023/24, which reflected the weakness of the promoted clubs.
There is an opportunity, then, for those currently in trouble to get out of it, although it should be said that only three times this century have the entire bottom three after 100 matches stayed up, and none since 2017/18.
The clubs who drop into the bottom three after MW10 tend to come from nearby.
If we isolate the last 10 years, we can see that only twice has a team who sat 14th or higher after 100 matches gone down, and one of those – ninth-placed AFC Bournemouth in 2019/20 – had the excuse of an enormous break for the national lockdowns that disrupted the league table.
Position changes in bottom three: MW10 v MW38
| Season | No. of position changes | MW10 position of teams who dropped into bottom three |
|---|---|---|
| 2015/16 | 1 | 16th |
| 2016/17 | 1 | 15th |
| 2017/18 | 3 | 14th, 15th, 17th |
| 2018/19 | 1 | 17th |
| 2019/20 | 1 | 9th |
| 2020/21 | 1 | 17th |
| 2021/22 | 1 | 16th |
| 2022/23 | 1 | 15th |
| 2023/24 | 0 | – |
| 2024/25 | 1 | 15th |
The table above makes for relaxing reading for fans of Brentford (12th) and Sunderland (fourth) in particular, because it would take something historic for either of these clubs, both tipped as relegation candidates back in August, to go down from here.
How frequent are big leaps up or down the table?
We have been less stats-led on this one, because some movements are more significant than others, but suffice to say we only found five Premier League campaigns in the 21st century in which no single club moved eight places or more between MW10 and MW38.
Even in those five, there is usually a club rising or plunging by six or seven places, although interestingly, there are very few occasions of more than two clubs seeing their league position change substantially from the 100-game mark onwards.
To put it another way, there is a high chance one or two clubs will either dramatically rise or sink like a stone.
Here are a few of the most prominent historic examples.
In 2008/09, Spurs rose from 20th to eighth, an extraordinary recovery made by Harry Redknapp after he replaced Juande Ramos in October 2008.
Crystal Palace achieved something similar in 2013/14 when they climbed from 20th to 11th after Tony Pulis swooped in to replace Ian Holloway and get the club back on its feet.
Man City went from 18th to ninth in 2002/03. But Newcastle are the masters of this, rising from 19th to at least six places higher on no fewer than three occasions, in 1999/00, 2018/19 and 2021/22.
One thing all these teams had in common was dramatic underperformance in the first 10 matches. The most likely side in 2025/26 to follow that trend, then, are 19th-placed Nottingham Forest.
Going the other way, in 2005/06, Wigan Athletic were second in the table after 10 matches but finished 10th, the promoted side unable to sustain their incredible start under Paul Jewel.
In 2008/09 Hull City were fifth after MW10 but finished 17th; in 2010/11 Blackpool were ninth but ended up relegated in 19th; and in 2016/17 Watford were 7th but finished 17th.
The theme here is overachievement followed by regression to the mean, which might worry a few Sunderland fans this season.
Does a team with no wins after MW10 always go down?
In the 21st century there have been 16 examples of Premier League clubs with zero wins after MW10, and for the sake of struggling Wolverhampton Wanderers, it is worth taking a closer look at each one.
It is possible to stay up. Four of those 16 teams (25 per cent) achieved it, including of course Wolves themselves last season.
But seven (43 per cent) ended up rock bottom and a further four (25 per cent) came 19th. In a strange quirk, no team this century have failed to win any of their first 10 and then come 18th.
Perhaps those in Wolves’ predicament are either doomed to stay rooted or will make a miraculous full recovery.
Case in point, only four teams have ever won more than 34 points after failing to win any of their first 10 matches, and all four sailed through the 40-point barrier, getting somewhere between 42 and 49 points.
That would suggest Wolverhampton Wanderers – as they did with Vitor Pereira last season – need more than just a boost. They need a radical departure from what we’ve seen so far.